Graph based trace analysis for microservice architecture understanding and problem diagnosis
Conference/Journal: ESEC/FSE
Created: January 22, 2021 1:47 PM
Created by: Zeyan Li
Rank: A
Tags: Tool, Trace Analysis
Type: Research Paper
Year: 2020
这篇文章提出了一个处理和分析trace数据的系统 GMTA

trace数据的表示

有完全相同结构的trace被抽象为path,span被抽象为对应的hop。
通过key operation把相关的path可以聚合为一个business flow
EP chain指的是error propagation chain,是通过span里的error字段收集的。
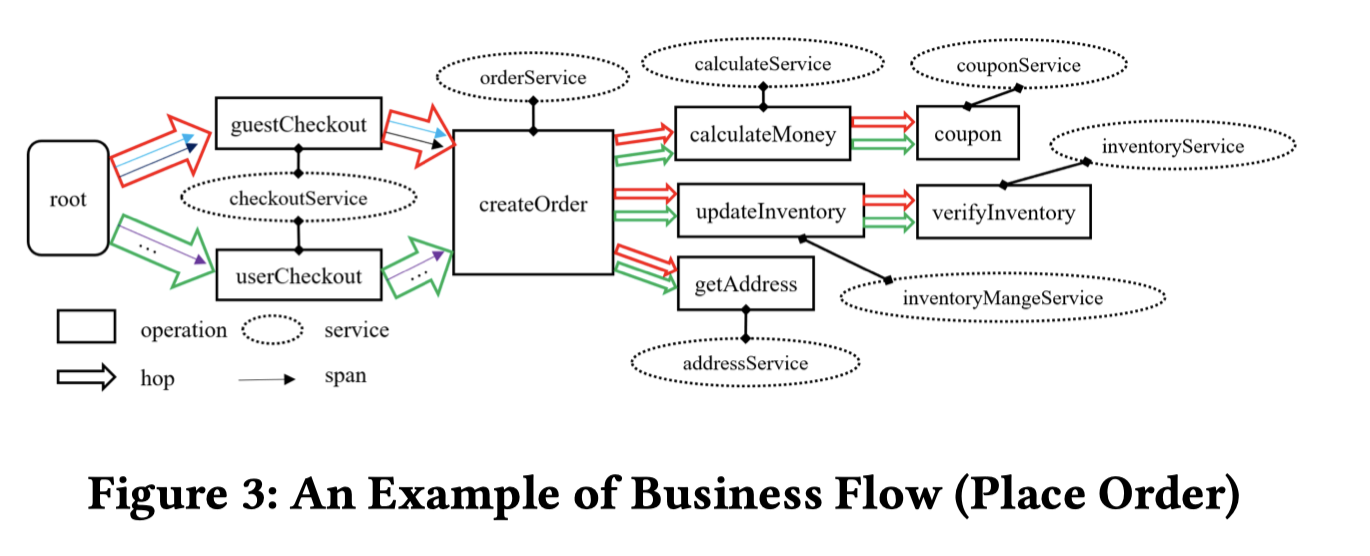
图上红色和绿色的粗箭头分别是两个path的hops
trace数据的预处理
trace数据的聚合
流式地聚合有相同trace id的spans,最大时限为5min
trace数据的修复
- Invalid operation name
- 比如把url里的id部分当作operation name的一部分记录下来了
- we can identify invalid operation names in span logs by monitoring the changes of the numbers of different operation names of the same services
- We prompt users to check the identified invalid operation names and ask the users to provide matching and replacement rules, e.g., using regular expressions
- broken trace
- 例如 the parent span ID is missing in the span.
- 分类
- 没有根节点
- 添加一个虚拟的根节点,且所有类似trace公用这个虚拟节点
- 有多个根节点,或者存在没有上级span的span
- 通过timestamp matching为某个subtree的root节点,或者没有上级span的span寻找上级
- start_A ≤ start_B ≤ end_B ≤ end_A,则A是B的上级。其中A需要是叶节点,B是没有parent的span。
- 通过timestamp matching为某个subtree的root节点,或者没有上级span的span寻找上级
- 没有根节点
Path Identification
通过hash算法快速匹配结构相同的trace。

Business Flow Identification
人工制定相关的匹配规则
A business flow can be defined as a logical combination (using AND/OR operations) of any number of basic conditions of the following two types:
(1) a service operation is invoked;
(2) a service operation is invoked before or after another one.
Data Access
trace level
- 查看具体某一条trace
- 搜索包含某个operation的trace
Path level
- 搜索包含某个operation的path
- 查看具体某一个path
business flow level
- 搜索包含某个path的business flow
- 查看具体某个business flow
Data Storage
图数据库 neo4j
OLAP databases like Druid and Clickhouse

Use Case: Architecture Understanding
U1. as developers, to visualize the dependencies and dependents of a service in a business flow to determine the change impact of the service.
U2. as architects, to learn the paths and metrics related to critical businesses (e.g., payment) to support architectural decisions.
U3. as SREs, to confirm the changes or patterns of service behaviors, and evaluate the impact of business changes or other factors on metrics such as traffic, latency, and error rate.
U1和U2通过直接调用对trace,path和business flow的可视化实现

U3可以通过GMTA对两个不同时间的对象的比较实现

Use Case:Problem Diagnosis
U4. as SREs, to reduce the root cause scope of a production problem by comparing the business flows before and after the problem occurs and analyzing the EP chains.
- 通过比较视图,比较故障前后的business flow的区别
- GMTA可以highlight出来数量突增的EP chain
U5. as SREs, to retrieve EP chains and visualize them for given operation(s)/service(s) based on observations such as service/application alerts.
- 查询和可视化特定operation对应的EP chain
Evaluation
study data
eBay的实际数据。
3000个microservice
100,000个operation
10 business domain
thousands of paths
26 billions spans a day
1% sampling rate
对比
In the study, we compare GMTA with two traditional trace processing approaches, i.e., OTD-R and ATD-R, qualitatively and quantitatively. OTD-R stores the original trace data (i.e., spans, traces, and their properties) in a relational analytics database. ATD-R aggregates the traces into paths but still stores the trace and path data in a relational analytics database.

Created : February 13, 2023